New to You in Our Latest Update!
Did you review an older version of this course? This Book highlights the new features you can expect to see in this version. This site upgrade includes:
- A revamped support portal for opening and managing your support requests.
- Information for setting up the Brickfield Labs Accessibility Toolkit (Starter version).
- Disabling specific H5P content types to prevent instructors from using them.
- New labeling for activity completion and due date requirements.
All links open in a new window.
3. Brickfield Labs Accessibility Toolkit
3.1. Accessibility Toolkit Reports
Error List
The Error List is arguably the most immediately functional of the reports available. This report is simply a complete list of all accessibility issues the analysis found in a course, broken down by the Activity name, the type of issue, the troublesome text, and which line of text it's located in.
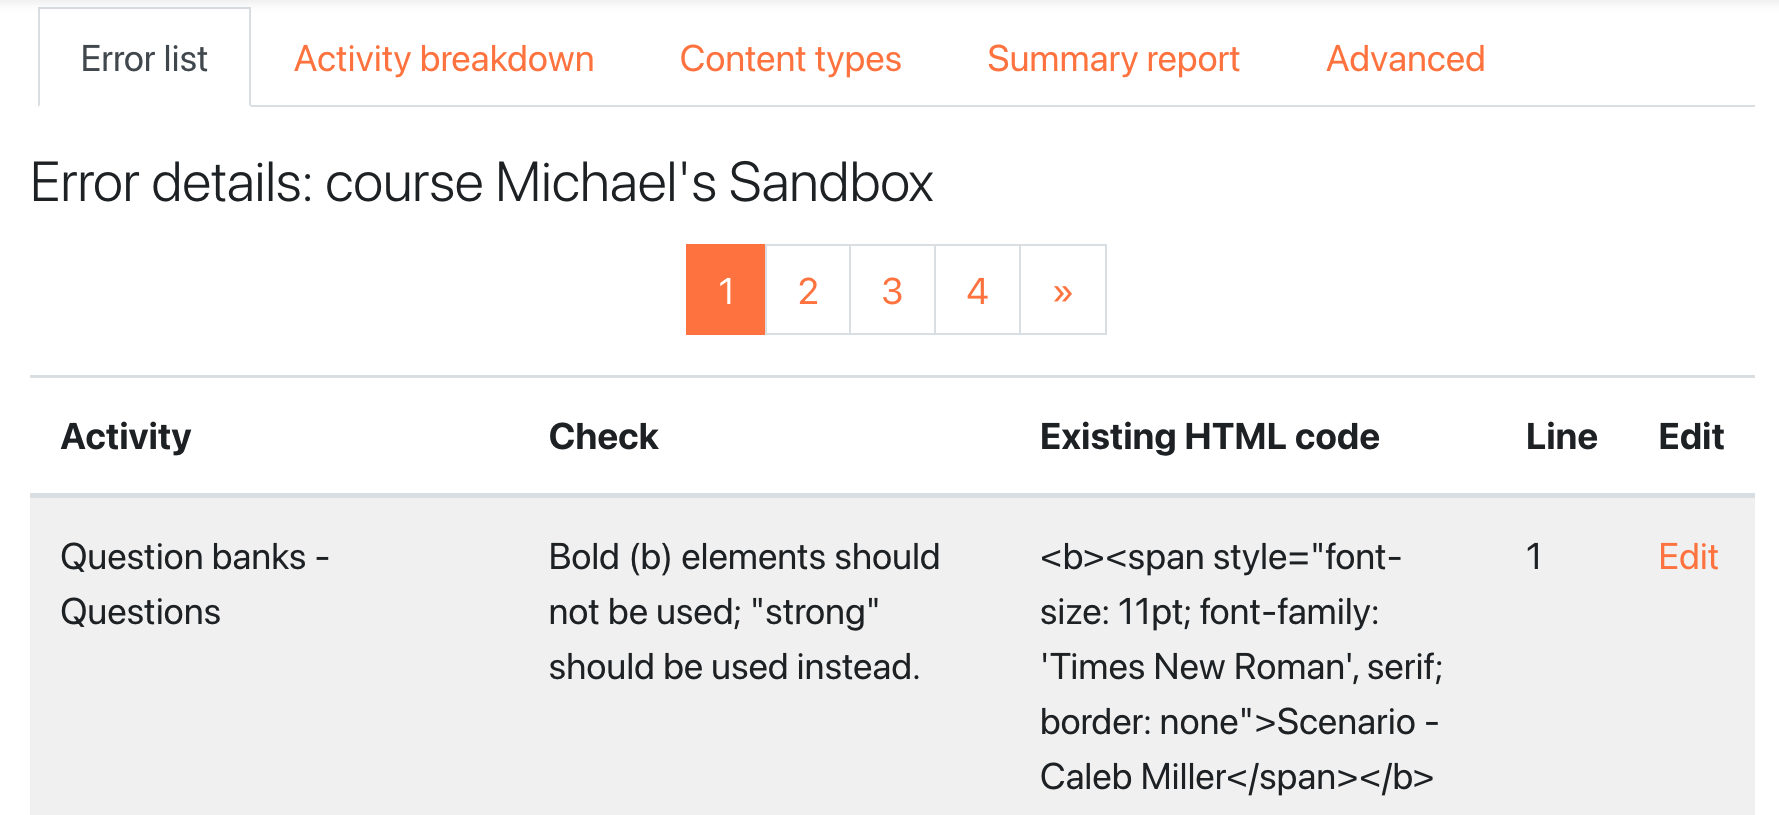
Our favorite feature of this page is the Edit link next to each item. Clicking the edit link will take you directly to the editing page for that content, saving you the time of having to manually find the content in the course.
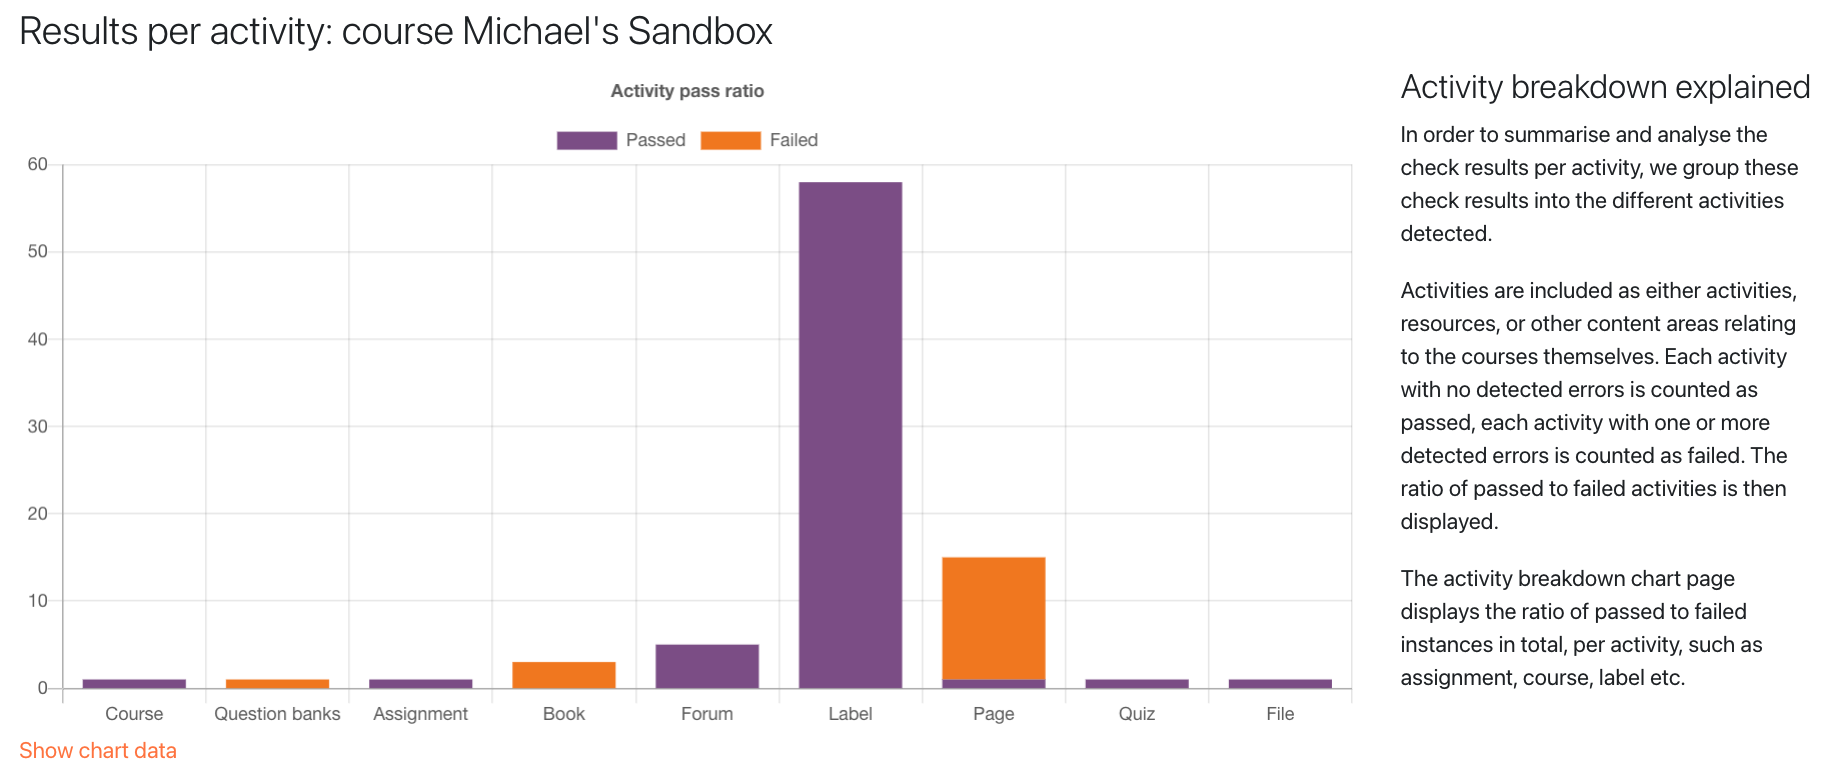
Activity Breakdown
The Activity Breakdown report shows a stacked bar chart of all resource types present in your course, with columns indicating how many of each type passed or failed analysis. This report is a helpful way to identify areas where instructors and content developers are doing a great job making content accessible, and areas where improvement is needed. Clicking the "Show chart data" link beneath the chart will expand a table that lists the same data.
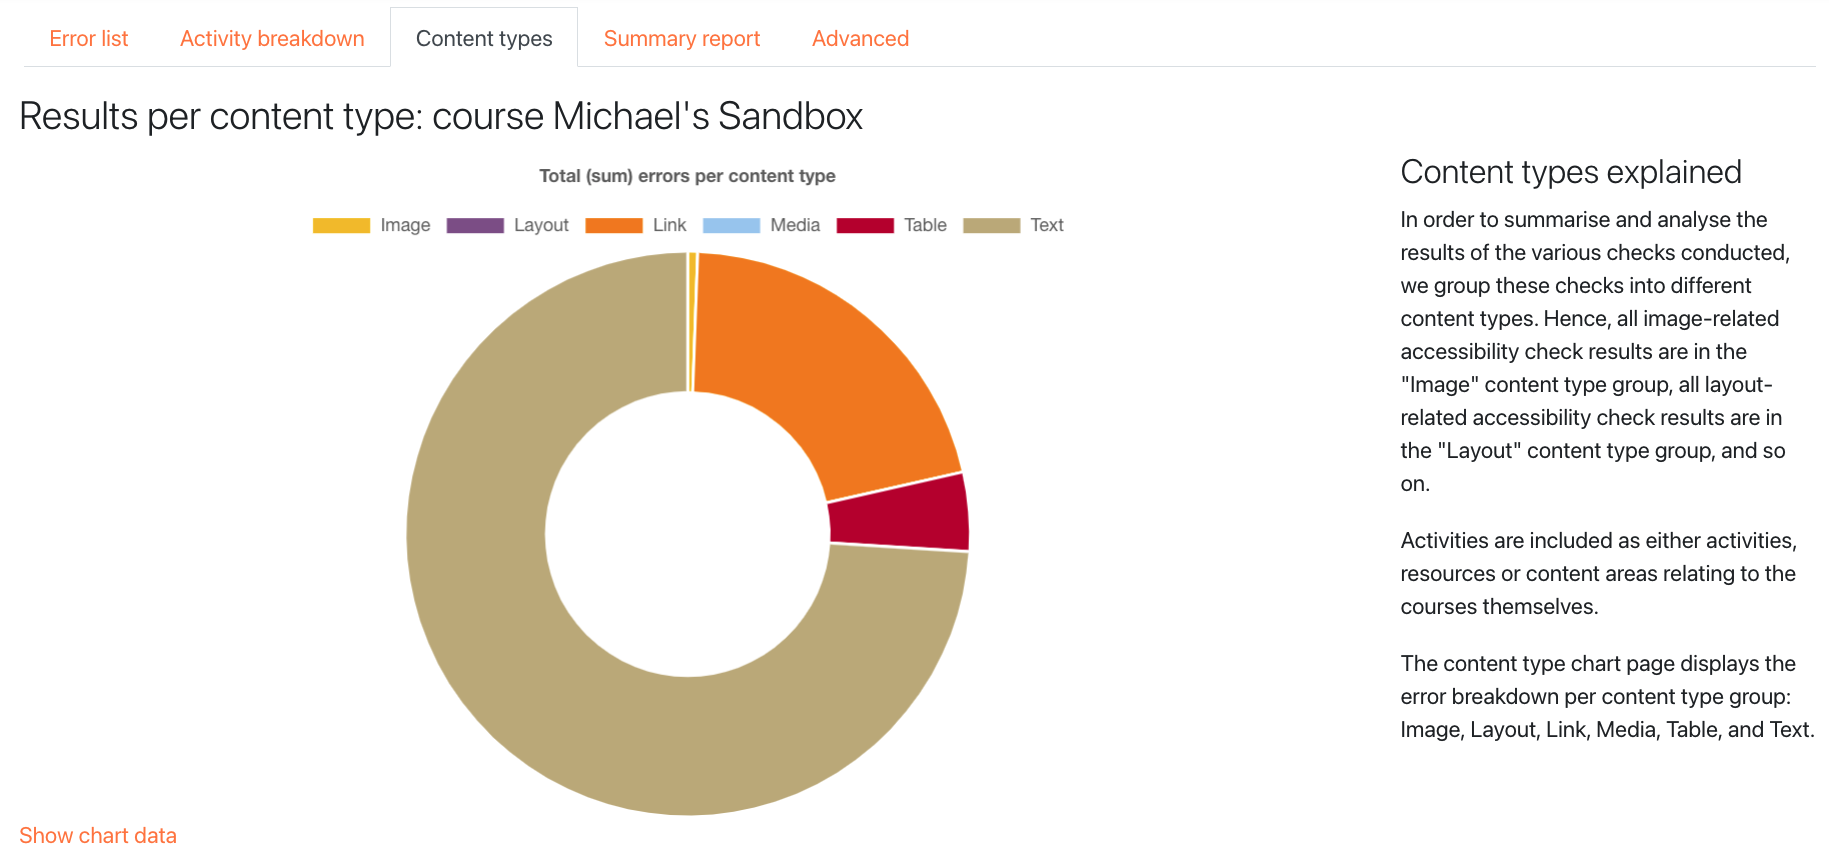
Content Types
The Content Types report is similar to the Activity Breakdown report. But while the Activity Breakdown report focuses on specific activity types like the question bank, assignments, books, forums, etc, the Content Types report focuses on specific types of content. These include: images, layout, links, media, tables, and text. The information is displayed as a doughnut chart. Like the Activity Breakdown report, you can click the "Show Chart Data" link below the chart to expand a table that lists the same data.
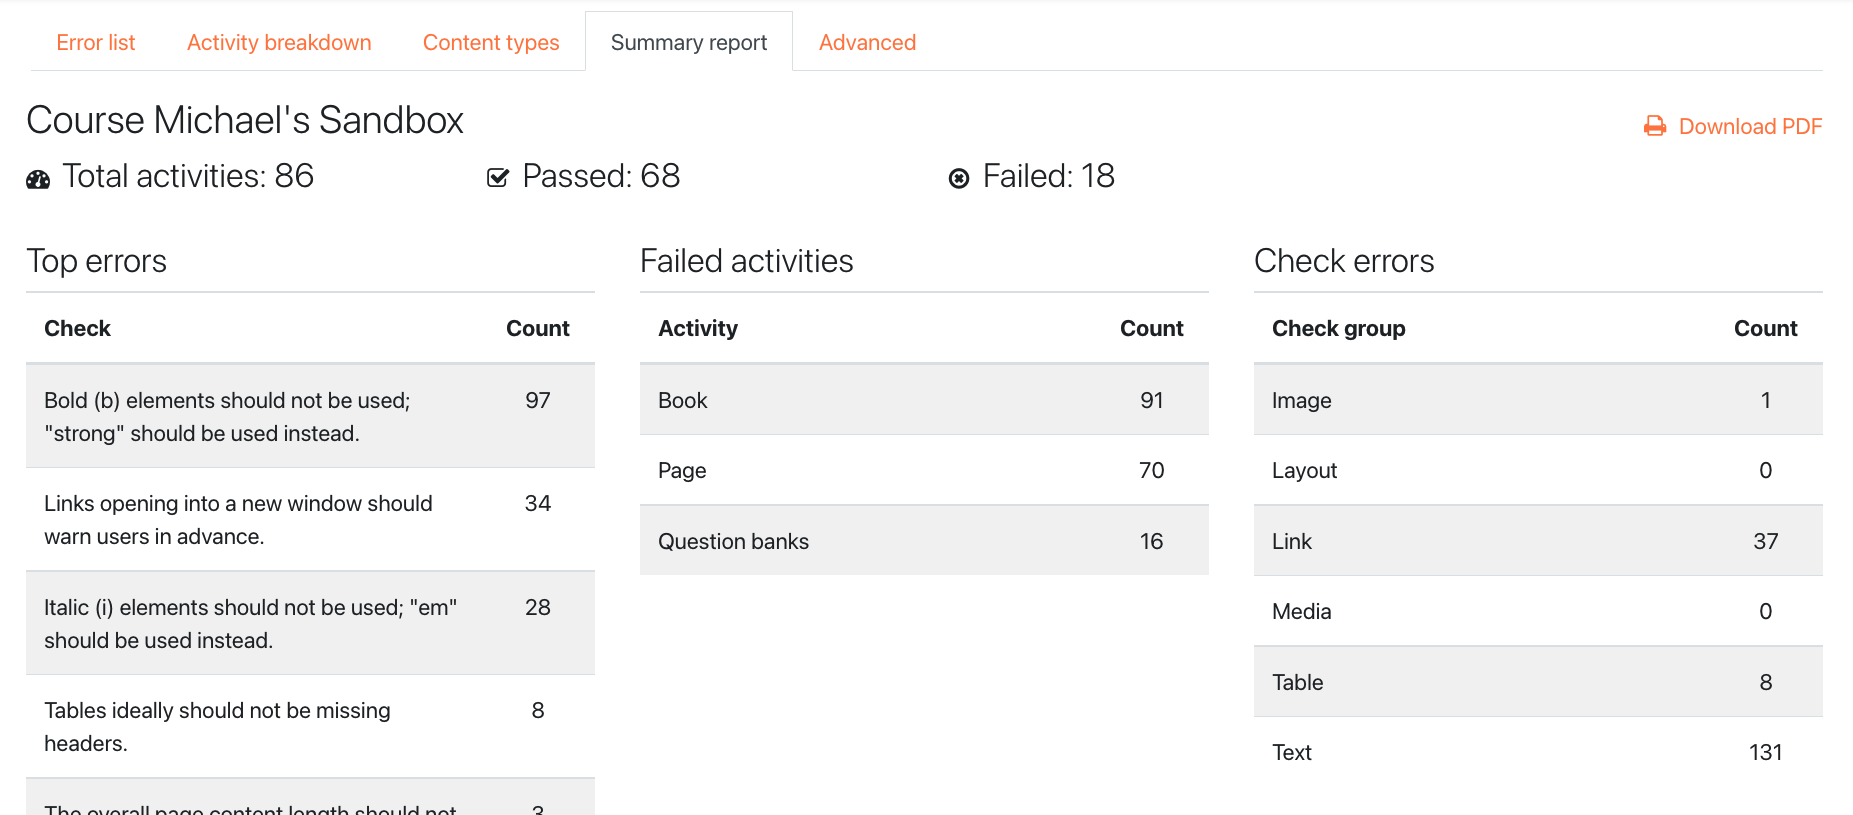
Summary Report
Though this report is listed last, it's arguably the most useful starting point. This report lists top-level information about your analysis results. These lists include:
- The total number of activities in the course, broken down by passed and failed
- The top errors, broken down by type and amount
- Failed activities, broken down by the number of errors in each
- Check errors, broken down by content type
- Activity pass ratio, broken down by activity type and how many of each passed and failed
- Error details, listing the first 50 errors found
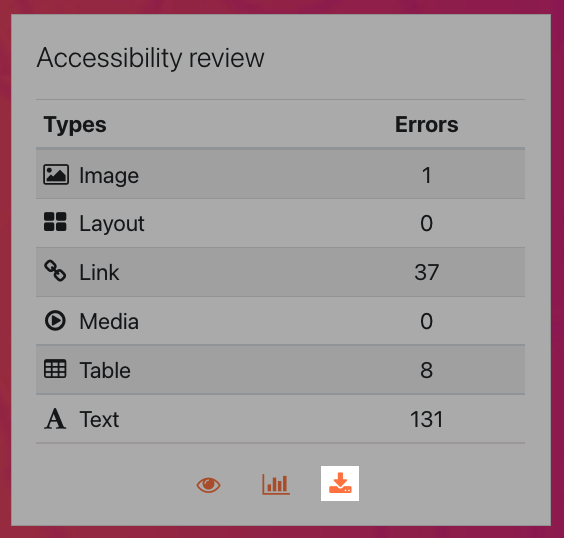
You can download a PDF of this report by clicking the Download PDF link in the report, or clicking the download icon in the Accessibility Review block (this block must be added to the course home page to access the Summary Report using this method).